RESEARCH
Spatial Data Exploration

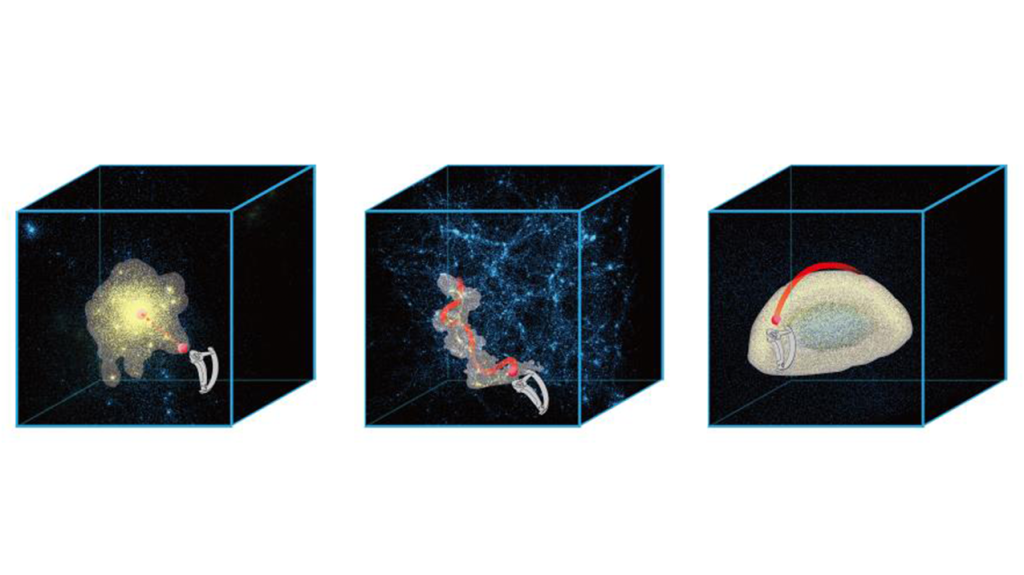
Spatial data exploration has become a significant research topic in the field of Big Data and Visualization. Yet, working in three dimensions is particularly challenging since many 3D datasets are dense, and relevant features of the data are often occluded or not yet defined. We are trying to design and develop effective and efficient interaction techniques for data exploration.
Spatial interfaces, including tactile and tangible interface, mid-air gesture interface, provide natural interactions in the third dimension, and thus, show great potential in studying spatial data. I am interested in studying the effect of spatial interaction techniques which take into consideration data features and users’ intention.
Immersive Visualization and Interaction
Immersive environments, including virtual, augmented, and mixed reality, offer users an engaging avenue to interact with presented information. However, they also pose challenges in the context of data exploration, such as occlusion and imprecise inputs. Additionally, these environments break the constraints of limited space inherent in 2D screens, the indirect interaction methods of keyboards and mice, and the traditional approaches to collaborative exploration. Our focus revolves around delving into multiple facets of immersive visualizations and interactions, encompassing elements like engaging displays, embodied interaction, situated visualization, user behaviors, and experiences.
Visual Data Storytelling

The amount of data produced by imaging systems is growing in size and complexity. Domain experts are analyzing and discussing the data, extracting useful information and insights. Clear presentation and successful communication of the results is essential for sharing the domain experts’ understanding. Here, visual storytelling, based on creating visual stories from data, provides an effective communication solution.
Accessible Interaction and Visualization

In a data-driven world, extracting insights from complex information is crucial. Data visualization supports this by leveraging human pattern recognition and exploratory abilities. However, its reliance on visual representations can create accessibility barriers for users with sensory, motor, or cognitive impairments, as well as those with situational constraints. To address this, we develop frameworks that integrate alternative sensory modalities, ensuring more inclusive access to data. By understanding diverse user needs, designing accessibility support tools, and enabling customized data representations, we aim to enhance information access, consumption, and creation across abilities and contexts.
Mobile and wearable devices, such as smartwatches, are widely used in daily life to collect, track, and monitor personal health and fitness data, such as heart rate, calories burned, and exercise time. Users commonly need to read data from their smartwatches at a glance, especially when doing physical exercises. Different from a desk monitor or a regular display, smartwatches always have a small screen size and limited space to display data, which brings additional challenges for reading visualizations, especially when in motion. To understand what the research challenges and opportunities are for visualizations displayed on mobile and wearable devices such as smartwatches and fitness trackers, we first reviewed the current designs of data representations on smartwatches. We next discussed how motion characteristics, such as speed, trajectory, direction, and acceleration, may impact the data design that needs to be read within a brief, on a small screen, and under motion. We then proposed a dedicated research agenda for visualization in motion on smartwatches.
Tangible widgets have been shown to reduce cognitive load, enable more natural interactions, and support the completion of complex data exploration tasks. Yet, the field lacks a structured understanding of how task types, interaction methods, and widget designs are coordinated, limiting the ability to identify recurring design patterns and opportunities for innovation. To address this gap, we conduct a systematic review to analyze existing work and characterize the current design of data exploration tasks, interactions, and tangible visualization widgets. We next reflect based on our findings and propose a research agenda to inform the development of a future widget design toolkit for tangible data exploration.
With the rapid rise of artificial intelligence (AI) and large language models (LLMs), AI holds growing promise for enhancing data communication, ranging from interpreting complex datasets to generating visual and textual narratives. Yet despite progress, current models remain limited in supporting reliable, multimodal, and temporally grounded communication. Most advances focus on static or single-modality outputs (e.g., charts from text), while dynamic data streams, such as those embedded in video or interactive systems, remain underexplored. We conduct early exploration on AI-assisted data communication. First, we examine how general-purpose multimodal LLMs (e.g., ChatGPT and Gemini) support visual analytics in video, focusing on data extraction, temporal reasoning, and audio-visual alignment. Second, we experiment with structured agent design: decomposing tasks, enforcing modular reasoning, and generating verifiable outputs to improve visualization reliability. We see our current work as a foundation toward more robust pipelines connecting data understanding, visualization, and narrative generation. We welcome collaboration from visualization and AI communities to advance this emerging intersection.